Stocks: Another Failed Breakout Fuels More Uncertainty Ahead of the Fed
NDX
+0.27%
Add to/Remove from Watchlist
Add to Watchlist
Add Position
Position added successfully to:
Please name your holdings portfolio
Type:
BUY
SELL
Date:
Amount:
Price
Point Value:
Leverage:
1:1
1:10
1:25
1:50
1:100
1:200
1:400
1:500
1:1000
Commission:
Create New Watchlist
Create
Create a new holdings portfolio
Add
Create
+ Add another position
Close
US500
+0.44%
Add to/Remove from Watchlist
Add to Watchlist
Add Position
Position added successfully to:
Please name your holdings portfolio
Type:
BUY
SELL
Date:
Amount:
Price
Point Value:
Leverage:
1:1
1:10
1:25
1:50
1:100
1:200
1:400
1:500
1:1000
Commission:
Create New Watchlist
Create
Create a new holdings portfolio
Add
Create
+ Add another position
Close
ESM24
+0.30%
Add to/Remove from Watchlist
Add to Watchlist
Add Position
Position added successfully to:
Please name your holdings portfolio
Type:
BUY
SELL
Date:
Amount:
Price
Point Value:
Leverage:
1:1
1:10
1:25
1:50
1:100
1:200
1:400
1:500
1:1000
Commission:
Create New Watchlist
Create
Create a new holdings portfolio
Add
Create
+ Add another position
Close
VIX
-2.30%
Add to/Remove from Watchlist
Add to Watchlist
Add Position
Position added successfully to:
Please name your holdings portfolio
Type:
BUY
SELL
Date:
Amount:
Price
Point Value:
Leverage:
1:1
1:10
1:25
1:50
1:100
1:200
1:400
1:500
1:1000
Commission:
Create New Watchlist
Create
Create a new holdings portfolio
Add
Create
+ Add another position
Close
On Friday, the S&P 500 lost almost 0.7%, and yesterday, it gained 0.63%. The market basically continued to trade within a two-week-long consolidation below the previous Friday’s new record high of 5,189.26, and above the support level of around 5,100.
The question remains: will stocks break higher and reach new all-time highs? This morning, the S&P 500 futures contract is trading 0.4% lower, indicating a lower opening for the index today. The market will be waiting for the very important FOMC Rate Decision tomorrow.
On March 1, I mentioned about February, And in the first weeks of March, it was the same story again. However, last week, the S&P 500 went closer to its record high once more, only to retreat towards 5,100 on Friday. Yesterday, it also went closer to highs, before pulling back to the 5,150 level.
While indexes were hitting new record highs, most stocks were essentially moving sideways. So, the question is – is this a topping pattern before a more meaningful correction? Still, there have been no confirmed negative signals; however, one might consider the possibility of a trend reversal.
Recently, the stock market continued to rally, fueled by advances in a handful of tech sector stocks, but as I wrote on February 7, Despite the previous week’s new record, this still holds true. Nevertheless, such volatility complicates short-term market predictions.
The investor sentiment remains elevated; last Wednesday’s AAII Investor Sentiment Survey showed that 45.9% of individual investors are bullish, while only 21.9% of them are bearish. The AAII sentiment is a contrary indicator in the sense that highly bullish readings may suggest excessive complacency and a lack of fear in the market. Conversely, bearish readings are favorable for market upturns.
The S&P 500 index continues to trade above an over month-long upward trend line, as we can see on the daily chart.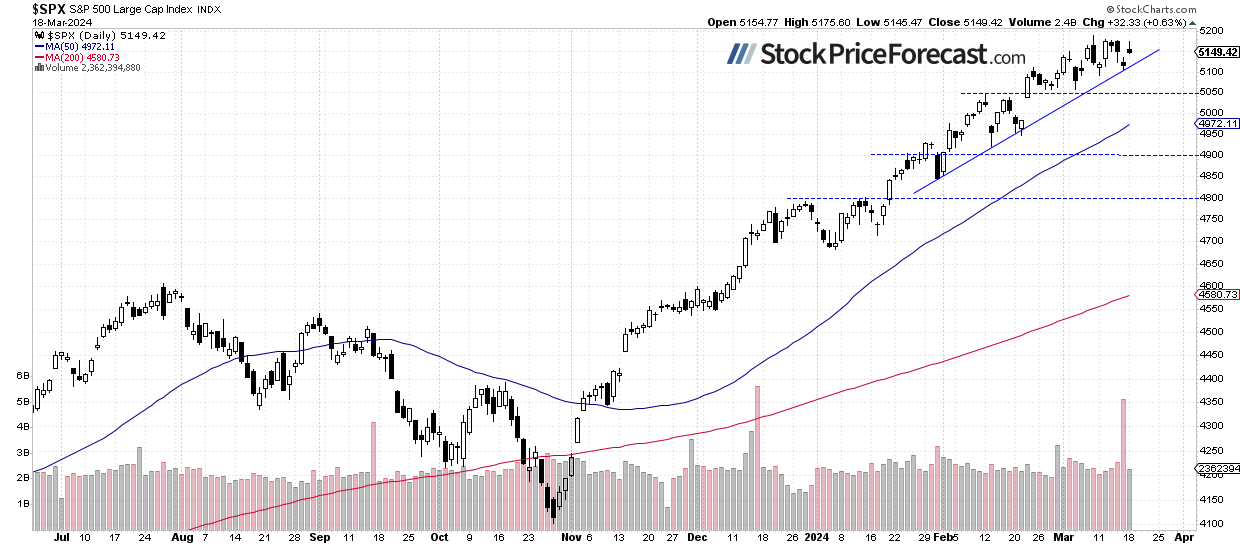 SPX Index-Daily Chart
Nasdaq 100 Remains Close to 18,000
On March 8, the technology-focused Nasdaq 100 index reached a new record high of 18,416.73, however, it quickly retraced the advance, and since then, it has been trading sideways. Last Friday, the market broke below previous local lows. Yesterday, it went as high as 18,124 before closing below 18,000 mark.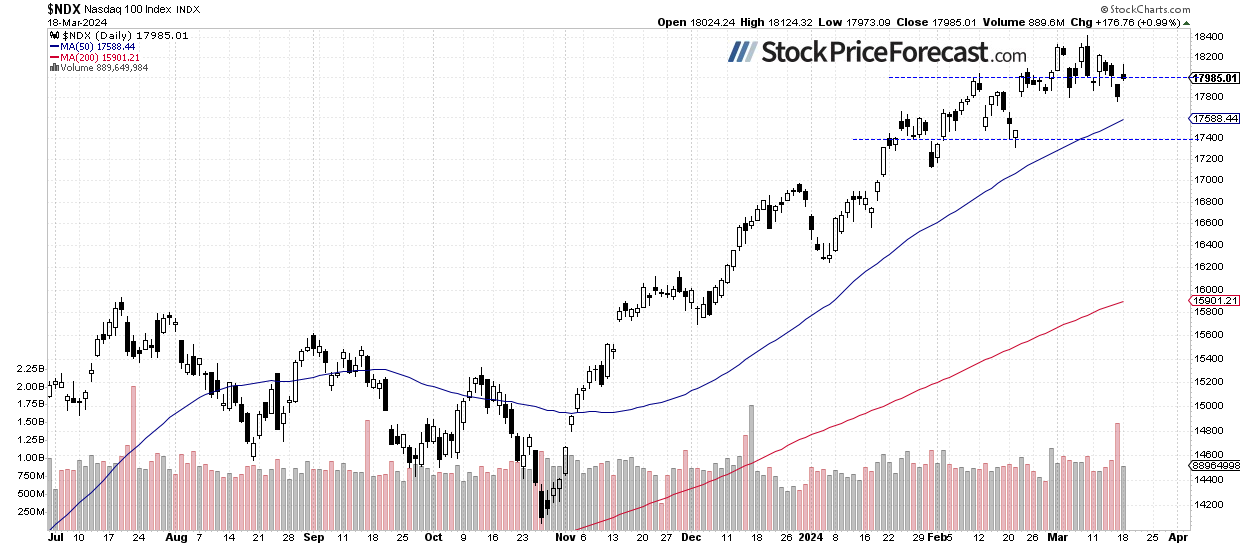 NDX-Daily Chart
VIX – Below 15
The VIX index, also known as the fear gauge, is derived from option prices. On Friday, it was as high as 15.50; however, before the close, it dipped below 14.50, suggesting less fear in the market. Yesterday, it remained below the 15 level.
Historically, a dropping VIX indicates less fear in the market, and rising VIX accompanies stock market downturns. However, the lower the VIX, the higher the probability of the market’s downward reversal.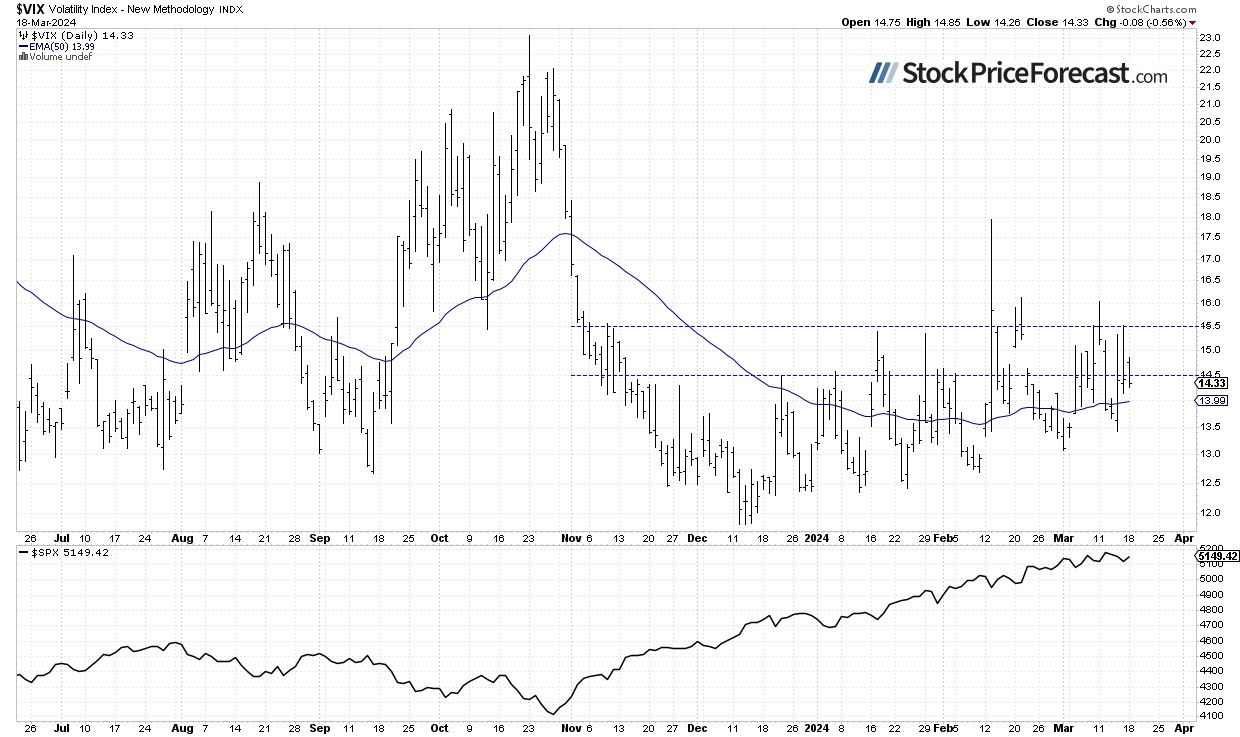 VIX-Daily Chart
Futures Contract – Consolidation Along 5,200
Let’s take a look at the hourly chart of the S&P 500 futures contract. Yesterday, it reached as high as 5,240, and this morning, it’s trading below the 5,200 level. While it still appears to be consolidating within an uptrend, the possibility of a topping pattern cannot be dismissed.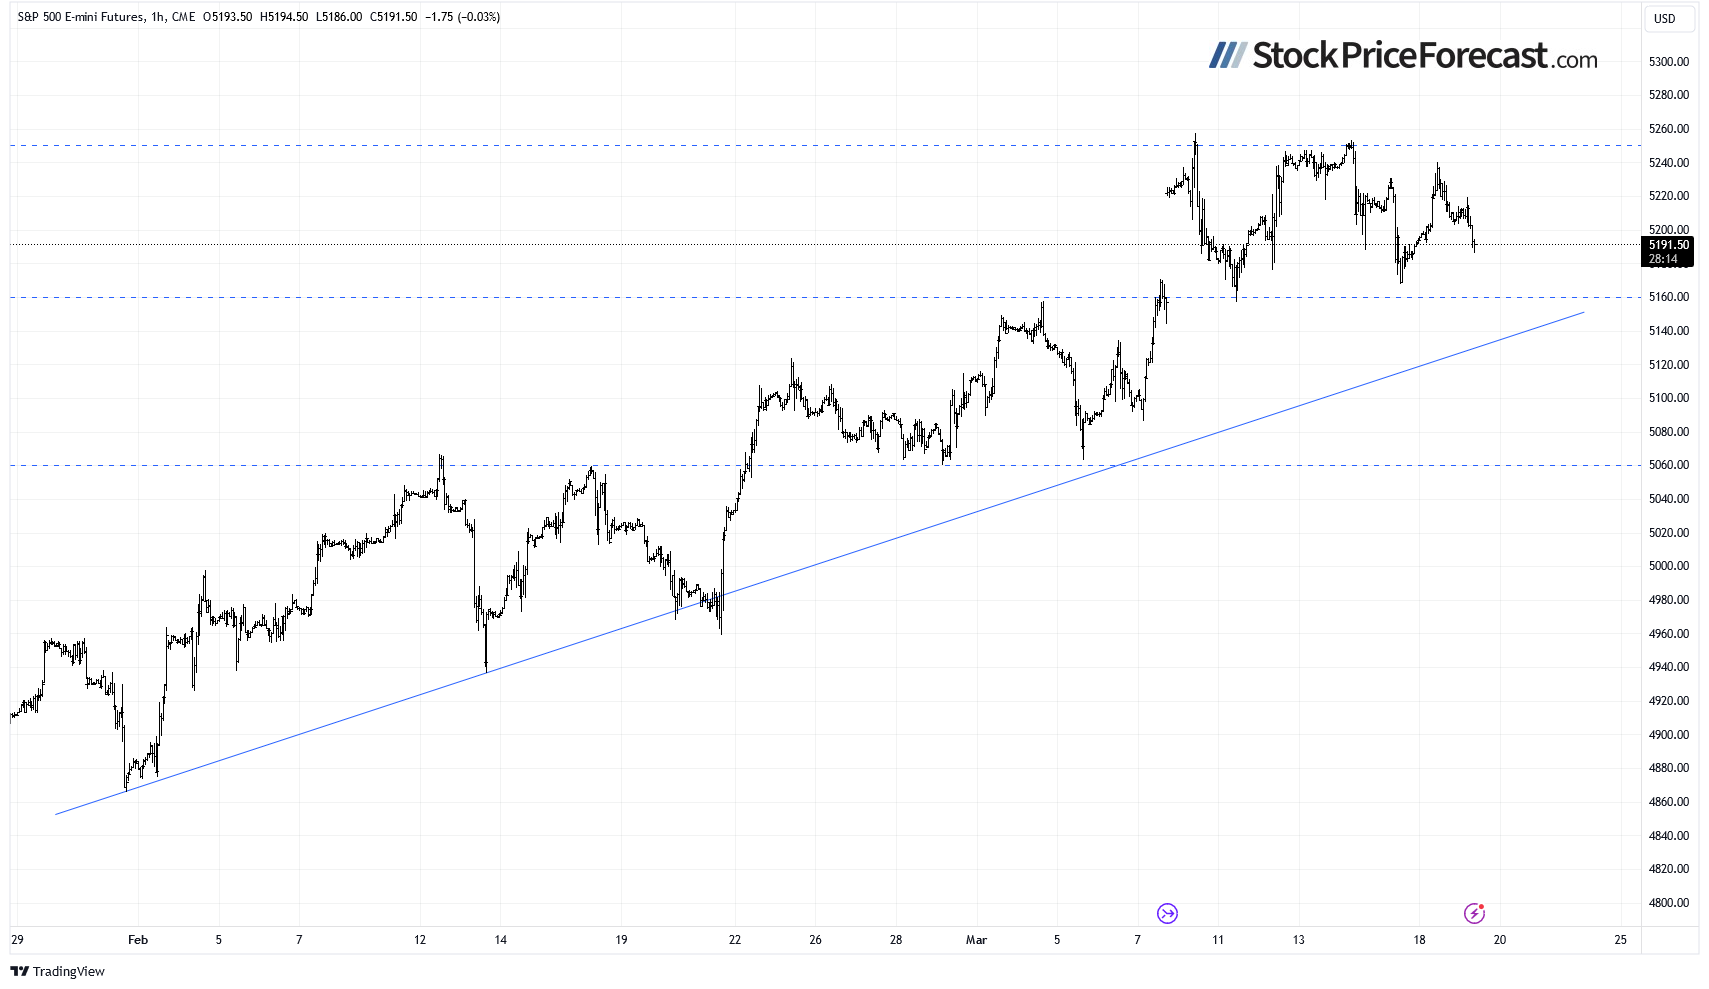 S&P 500 Futures Chart
Conclusion
The recent trading action was very bullish, with some of the tech stocks rallying to new record highs, the S&P 500 index breaking above 5,100, and the Nasdaq 100 index reaching above the 18,000.
Today, the S&P 500 index is likely to open 0.4% lower, and it may see more profit-taking action ahead of the important Fed release tomorrow. On March 5, I wrote that Despite the recent record-breaking advance, it remains a probable scenario.
In my Stock Price Forecast for March, I noted
For now, my short-term outlook remains neutral.
Here’s the breakdown:
- The S&P 500 is likely to extend a consolidation, all eyes are on tomorrow’s Fed now.
- It still appears to be consolidating within an uptrend.
- In my opinion, the short-term outlook is neutral.


